BI course 02 — Preparing reliable measures and a report specification
A chart can look correct while counting the wrong thing. This chapter teaches how to define grain, select evidence and produce a small report specification that another analyst can reproduce. The examples are classroom calculations, not executed BI transformations.
In this lesson
Measure design and reproducible report specification
A chart can look correct while counting the wrong thing. This chapter teaches how to define grain (what one row represents), select evidence and produce a small report specification that another analyst can reproduce. The review-register calculations are fictional; the separate Asset register walkthrough describes observed staging data, a typed calculation and a saved chart binding, not an executed review-event transformation.
In this chapter
- Choose one row per meaningful unit
- State time boundaries and population explicitly
- Separate operational and measurement problems
- Inspect an actual dataset before configuring its table
- Profile the loaded rows before calculating
- Create a typed row-unit calculated field
- Bind the chart and verify the aggregation
- Define a reusable KPI separately from a row calculation
- Design a report around the decision
- Check your specification
Choose one row per meaningful unit
For the practice pack, the unit is one item. A review-event log may contain several events for the same item, so counting events would inflate the population. Keep the source log unchanged and create an analytical register with one row per eligible item.
Use the following complete fictional input. All events are in the same stated practice timezone and are available by the 10:00 cutoff.
- A: Due date: Friday; Latest review by 10:00: Accepted at 09:00; Evidence: Review note A1; Ready under the rule?: Yes.
- B: Due date: Friday; Latest review by 10:00: Changes needed at 09:30; Evidence: Review note B2; Ready under the rule?: No.
- C: Due date: Monday; Latest review by 10:00: No review; Evidence: None; Ready under the rule?: No. B also had Accepted at 08:00, but the later Changes needed event supersedes that classification for this snapshot. Do not select the earlier favorable event. An exact duplicate of A's 09:00 event is still one observation, not another item or another acceptance.
The ready rule is: the latest qualifying review by the cutoff is Accepted and has the required evidence. Missing review is not accepted. An Accepted label without the required evidence would also remain unverified under this rule.
State time boundaries and population explicitly
The baseline population is A, B and C. Its ready count is 1, eligible count 3 and rate 1/3, approximately 33.3 percent. If the question is Friday readiness, the population becomes A and B: 1/2 or 50 percent. The underlying work did not improve merely because the denominator changed.
Due date, creation date, event time and ingestion time (when the reporting source received the record) answer different questions. A due-date filter selects a deadline cohort. A review-event cutoff determines what was known at a checkpoint. A late-arriving event can change a reconstructed historical answer even when its event time is old.
Write the timezone and whether boundaries are inclusive before comparing snapshots. A generic Last 30 days label does not establish which field, timezone or endpoint convention a populated BI report uses.
Separate operational and measurement problems
B needs correction: that is an operational gap. A missing evidence reference on an Accepted review would be an evidence-quality gap. Duplicate rows would be a transformation problem. A report that fails to load is an availability problem. The remedies differ.
Do not edit or delete a source record merely to make a report agree. Preserve the observed result and compare included identities, latest-event selection and evidence rules. Ask the reporting owner to correct the analytical transformation when that is where the mismatch lies.
A useful reconciliation records included IDs, excluded IDs with reasons, the current classification and the exact source behind each classification. Equal totals are not enough: a report showing A and C as the two Friday items would still be wrong even if it returned 50 percent.
Inspect an actual dataset before configuring its table
Alongside the fictional review register, use the observed staging Asset register example to connect grain and field meaning to an actual Studio screen. The report is Academy BI — Asset lifecycle practice, a separate draft derived from Asset register overview in the Riverside workshop planning space. Its asset records are not the fictional A/B/C review items, and an active asset is not a measure of review readiness.
Identify the dataset and its coverage
Open Data, search for asset, and select Asset register. Similar catalogue names describe different subjects, including asset valuations, acquisitions and assignments; they are not interchangeable sources for a register question. Check the dataset name before using its fields.
Before the row-unit field was created, the Asset register header listed 27 columns. Its Preview displays 4 rows and 20 columns. The first number describes the dataset's available fields; the latter column count describes that preview. Do not infer that seven fields were deleted, or that a catalogue label Row estimate unavailable means no asset records exist.
Use Model to read the dataset's definition. In this staging example, the stated grain is one non-archived asset; archived assets and private notes are excluded. Therefore “all assets” would be too broad a description of the dataset's coverage. The model also retains source currency without automatic conversion. Before calculating a monetary total, establish a valid common-currency basis or an appropriate currency grouping instead of adding mixed amounts blindly.
A stated grain is the intended unit, not a substitute for checking record identities. The preview exposes both asset IDs and asset numbers. The four asset numbers in this example are AST-000002, AST-000003, AST-000001 and AST-000004. Retain that exact population when reconciling the report table; an equal row count with different assets would not be the same result.
Read the populated table's configuration
Return to Report, use Select, and select the Source records visual. The inspector identifies it as a Table, with Starting dataset: Asset register. Selecting the intended visual matters: a field binding or filter in its inspector applies to that visual, not automatically to every chart on the canvas.
The inspected column bindings are:
- Column: Field: Asset number; What to check: Recognisable asset reference for reconciliation.
- Column 2: Field: Asset name; What to check: Description, not a unique identity by itself.
- Column 3: Field: Category; What to check: Asset classification used in this register.
- Column 4: Field: Location; What to check: A blank cell is not a verified location.
- Column 5: Field: Lifecycle; What to check: The asset's lifecycle classification.
- Column 6: Field: Operational status; What to check: Its operational condition, distinct from lifecycle.
- Column 7: Field: Acquired on; What to check: The acquisition field; inspect its displayed representation. The rendered table can present the fields in a different visible order: the inspected Preview began with Acquired on, followed by Asset name and Asset number. Match the actual column headings to the values rather than assuming “Column 1” in the inspector must be the leftmost displayed column in every view. No column-reordering procedure is established by that difference alone.
Summarize with metric is set to Keep individual rows. The helper says that individual rows are shown and duplicates are retained, and that no active saved metrics are available for the starting dataset. This table therefore should not be described as an automatically deduplicated aggregate or as proof that a particular saved metric works. Add column and the existing field selectors are visible configuration controls; review the supported field choices before changing your own authorised practice table.
Reconcile field meanings before introducing a chart
AST-000002 is retired / unavailable. AST-000003 is active / inUse. AST-000001 and AST-000004 are active / available. The paired values are Lifecycle / Operational status: filtering active should retain the inUse asset as well as the available ones. Filtering available would answer a different operational question.
Acquired on appears as epoch-millisecond values (numeric timestamps rather than readable dates) in the observed table. The later Manage → Catalog → Asset register → Columns inspection identifies acquisition_date / Acquired on as a date dimension with status current, and likewise identifies in_service_date / In service on. This schema label does not establish a readable display format, accepted filter literal or timezone. Resolve those before presenting a date-based conclusion.
The first inspection found Dimension: Lifecycle but Value: Saved field unavailable on the neighbouring chart. That initial appearance did not establish an aggregation. The next sections show how the practice resolved the binding with an explicit row-unit calculation and verified the saved result. A chart that looks plausible is not a replacement for the source and configuration checks.
Profile the loaded rows before calculating
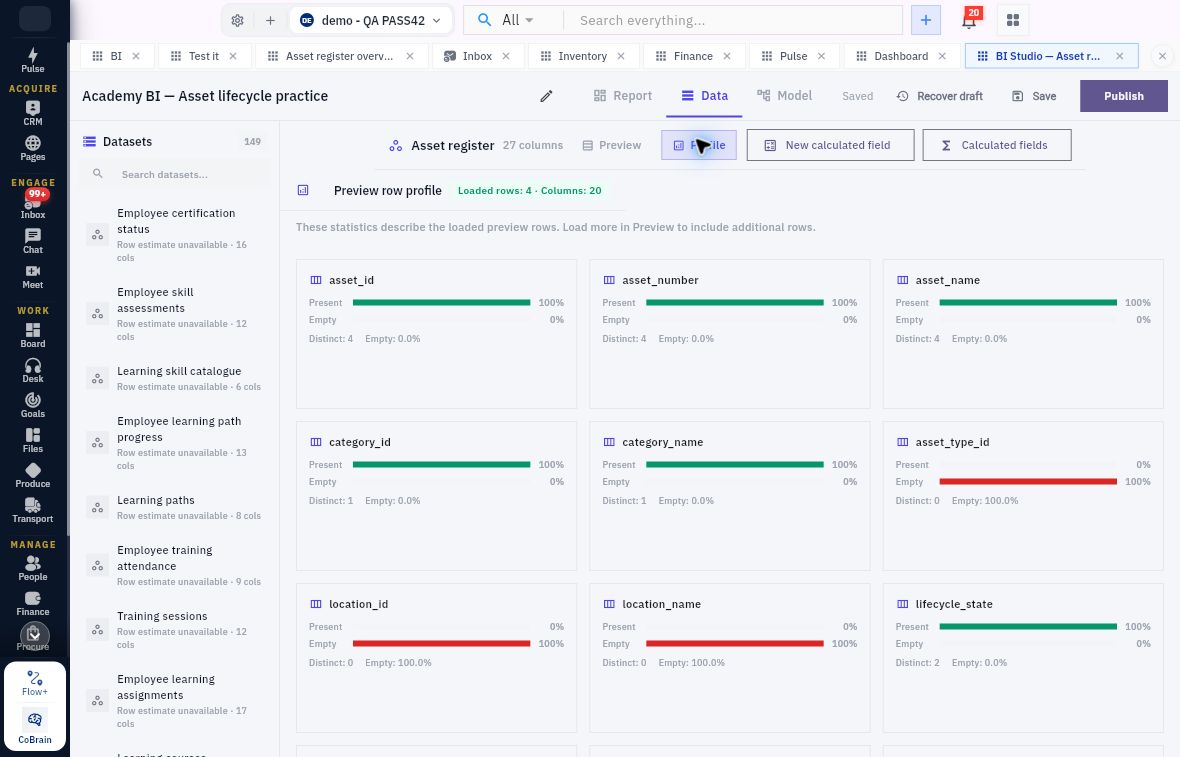
In Data → Asset register, choose Profile to inspect the loaded preview's quality. The screen labels its scope Preview row profile, with Loaded rows: 4 · Columns: 20, and explains that its statistics describe the loaded preview rows. Loading more in Preview is a separate way to include additional rows; these four-row statistics are not a completeness guarantee for every future query.
Create a one-per-asset calculated field
In the four-row preview, asset_id and asset_number are present on every row and each has four distinct values. Lifecycle has two distinct values, operational state has three, and Location is blank. These checks describe the loaded sample, not every asset in the system.
Create a field that counts one per asset
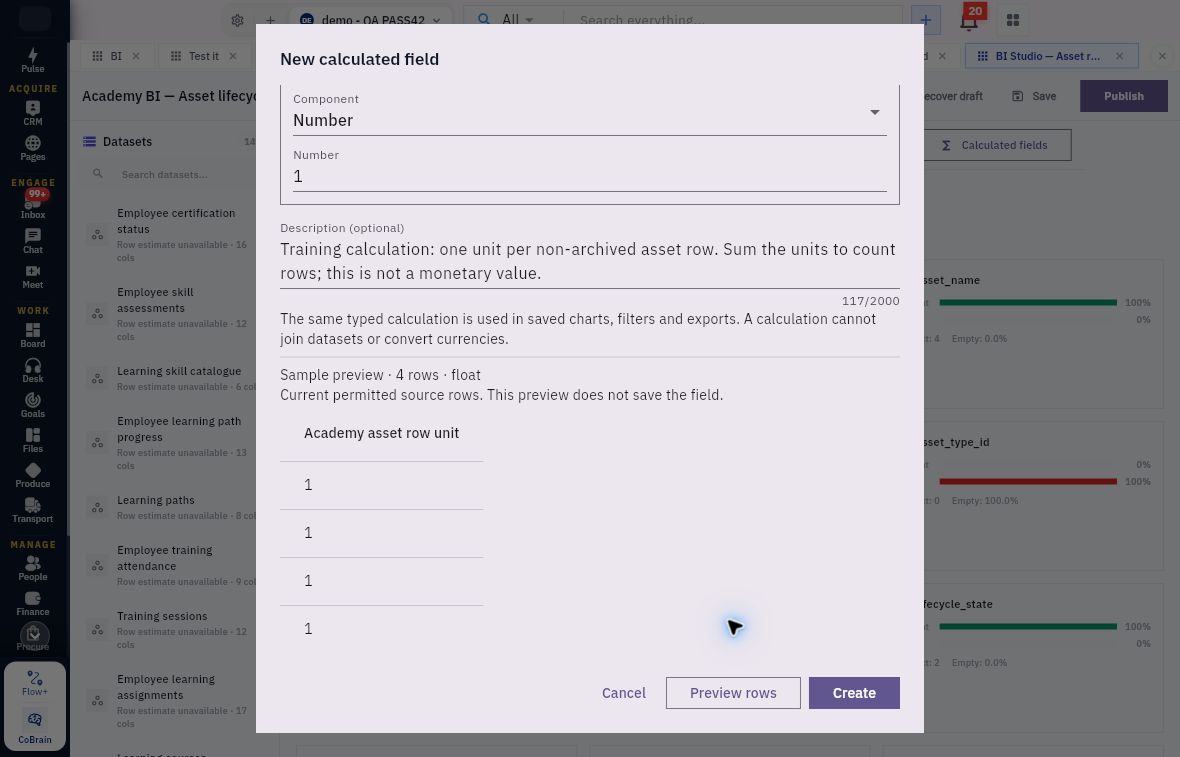
A row unit is the number 1 on each source row. When each asset appears once, adding these units counts the assets. Duplicate rows would also be counted, so check the asset IDs first. This is a count, not an asset value or a readiness score.
- Open Data → Asset register → New calculated field. Confirm the Dataset is Asset register.
- Enter Academy asset row unit in Field name, or use a different agreed practice name. If the example already exists, inspect it rather than creating a duplicate.
- Choose Use formula builder. The initial Left field/Operator/Right field form is for a different calculation style.
- Choose Component → Number, then set Number to 1.
- Add a description such as: “One unit per non-archived asset row. Sum the units to count rows; this is not a monetary value.” The calculation cannot join datasets or convert currencies.
- Select Preview rows. For the four-asset example, expect four values of 1. The preview labels the numeric type float and does not save the field. If the values differ, correct the Number input and preview again.
- Select Create once. Open Calculated fields, find the same name and inspect Edit calculated field. Confirm the dataset, Number 1 and description were saved.
The demonstrated field was saved as version 1. The catalogue then had 28 fields rather than the earlier 27, because this exercise added one calculated field.
Bind the chart and verify the aggregation
The reopened editor has Reload saved definition, Preview rows and Save field, rather than the new-field Create action. It shows current accessible usage and warns that saving affects future queries; changes to output type or source units are blocked while the field is in use. Inspect usage before changing a shared calculation. A zero usage count observed before the chart was bound is not a permanent property of the field.
If creation or saving has an uncertain result, inspect the existing named definition before retrying. Do not create another field simply because a later canvas is still loading. A valid preview, a created field and a saved report binding are three distinct checkpoints.
Bind the chart and verify the aggregation
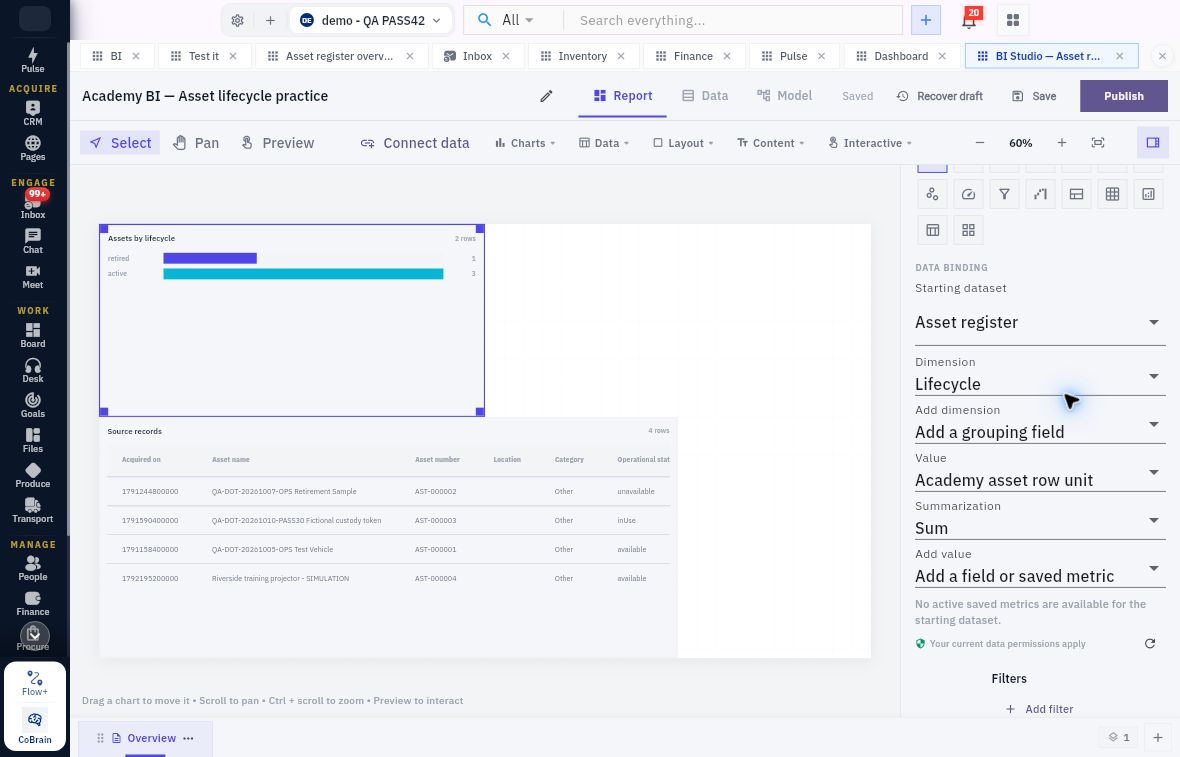
Return to Report, use Select, and choose Assets by lifecycle. Read the inspector's Starting dataset: Asset register. Set Dimension to Lifecycle and Value to Academy asset row unit. Dimension determines the category groups; Value supplies the numeric values aggregated within each group. The calculation is a field, not evidence that a separate saved metric has been created—the inspector can still say no active saved metrics are available.
The demonstrated Summarization default was Sum. Read it explicitly instead of relying on the default in another report. Its menu offers Sum, Average, Minimum, Maximum, Count and Distinct count. For this row-unit definition, Sum adds the ones: the one retired row gives 1, and the three active rows give 3.
Do not treat those aggregation choices as synonyms. Average, Minimum and Maximum of a group of ones each answer a different question from the group's size. Count is a counting operation rather than addition; before substituting it, verify what the selected field and implementation count, including missing values. Distinct count concerns different values: a constant 1 is not an asset identifier, so counting distinct row-unit values is not a distinct-asset count. Only Sum was evaluated in this worked configuration; the menu does not establish results for the other options.
Save the report and reopen the same named practice draft after a full reload. The retained inspector showed Lifecycle / Academy asset row unit / Sum, and the chart displayed retired 1 and active 3. The Source records table retained AST-000002, AST-000003, AST-000001 and AST-000004. These independent checks connect the saved configuration, result and underlying population, rather than trusting a chart with an unavailable value field.
Define a reusable KPI separately from a row calculation
Check your understanding: Why does the active category contain three assets even though one is inUse, not available? Lifecycle and Operational status are different fields. Also explain why duplicate asset rows would inflate this row-unit sum.
Create a reusable KPI
A calculated field returns a value for each row. A KPI (key performance indicator) defines a reusable measure, such as an asset count. In Explore → KPIs, open the Create KPI form when you need a new measure; inspect the existing practice KPI if it is already available.
For the demonstrated Academy asset count:
- Enter the KPI name and a description of what the count means.
- Choose Dataset: Asset register.
- Set Calculation: Aggregate a field. Formula from saved KPIs is a different option, not the per-row formula builder used earlier.
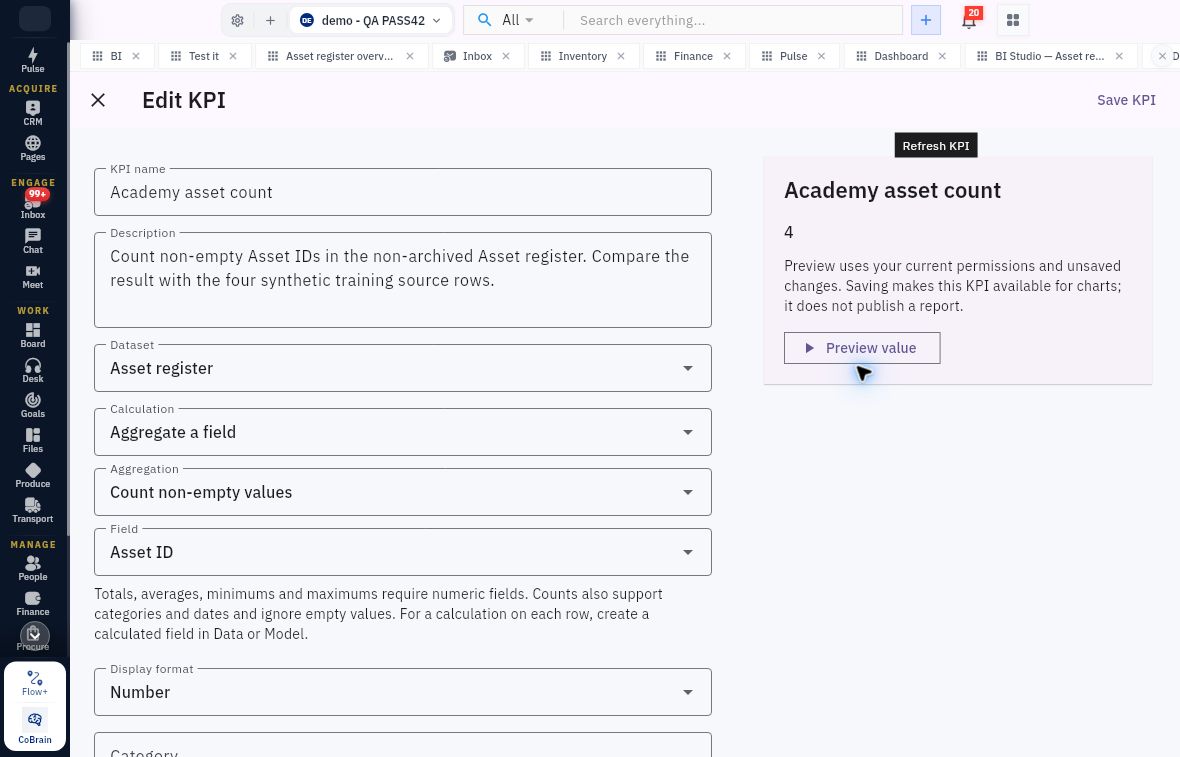
- Choose Aggregation: Count non-empty values and Field: Asset ID.
- Keep Display format: Number. Use Category and Tags to organise the KPI if needed.
- Select Preview value. The demonstrated result is 4, matching the four populated asset IDs.
- Select Save KPI once. Reopen the same KPI in Edit KPI, check the definition and select Preview value again.
Choose the aggregation deliberately
- Count non-empty values counts populated values. Repeated IDs are counted again.
- Count distinct values counts different populated values. Use it when the question requires unique IDs.
- Total, Average, Minimum and Maximum require numeric fields. Counts can also use categories and dates and ignore empty values.
A display format does not change the calculation’s meaning. Do not present an asset count as currency. A preview uses your current permissions and may not represent another viewer’s accessible records.
Optional Target value, Warning threshold and Critical threshold describe the KPI; they do not create notifications. Create an alert separately when notifications are needed, as covered in the next chapter.
Design a report around the decision
Reopening Edit KPI retained the same named definition, and Preview value again returned 4. The earlier inspectors' “no active saved metrics” messages describe the earlier stage, before this separate KPI was created; they are not a permanent statement about the dataset.
Keep the result precise: the saved definition and its reopened preview were verified, but the detail page's Current Value remained a dash with No value yet, including after Refresh KPI. Do not call that a persisted card value of 4, a scheduled refresh or a missing aggregate definition merely because a separate Formula label says “No formula defined”. This KPI used Aggregate a field, not Formula from saved KPIs. It was not added to the published report or used to create an alert. The earlier published chart and CSV still demonstrate the row-unit Sum configuration, not this later KPI.
Design a report around the decision
For the baseline, use a headline 1 of 3 ready, a small table listing A/B/C and the reason each is or is not ready, and a next-action summary: correct B and obtain C's review when needed. The table is more informative than a large green percentage alone.
If a chart is useful, use a zero baseline for counts, clear units, direct labels and text that does not depend on color. State the cutoff and population near the result. A 100-percent bar for one item should not look like more completed work than a 50-percent bar for ten without showing denominators.
A future native build specification should name the source dataset, field mappings, one-row-per-item transformation, latest-event rule, evidence requirement, filters, output labels and reconciliation tests. Do not invent Workroomly SQL syntax, Model behavior, widget types or refresh guarantees from button names. The demonstrated row-unit field and Sum chart establish the stated staging asset calculation. They do not implement the fictional review-event transformation, convert currencies or establish a refresh guarantee.
Check your specification
A proposed report counts A's duplicate review twice, uses B's old Accepted event and omits C. It shows three ready rows. The correct response identifies all three errors: duplicate grain, wrong latest event and missing population member. Restore the agreed register analytically; do not change the source history. The baseline remains 1/3 until new valid work or an explicitly revised scope changes it.
Turn what you learned into the way the team works.
Mark this lesson complete once the workflow exists in your workspace—not simply when you reach the bottom.